
For engineering firms, profitability isn’t just about winning the next tender. It’s about how well you use the team you’ve already got. Underused engineers quietly chip away at your margins. Overworked ones burn out or bolt. And if you're still relying on spreadsheets or gut feel to track who’s doing what, when — you're not alone. But you are at risk.
Resource utilisation is the metric that separates guesswork from strategy. Learn the formula. Track it properly. And you’ll finally have the clarity to plan ahead instead of playing catch-up.
Tracking utilisation properly leads to smarter hiring, scheduling, and healthier margins. Accurate data helps you know when to hire, redistribute work, or adjust timelines.Magnetic’s real-time dashboards give you a live view of billable vs non-billable work. See exactly where time goes and make changes before issues escalate.
In engineering firms, resource utilisation sits at the crossroads of profitability and quality. Get it wrong in either direction and the impact is immediate:
Too low and valuable hours slip away unbilled. Too high and you push your engineers to the point where mistakes creep in, quality drops, and good people start looking for the exit.
The right utilisation level does more than protect margins. It supports delivery, helping teams maintain focus without burning out and ensuring clients get the standard of work they expect.
For leaders, utilisation is a more-than-useful decision-making tool. When you know exactly how much billable capacity you have, you can set realistic project timelines, price work accurately and decide when it is time to hire or redistribute workloads. CFOs and COOs can use utilisation data to forecast revenue months ahead instead of reacting to problems when it is too late.
Without this visibility, staffing decisions become guesswork and project planning turns reactive. With it, you can balance your team’s workload, protect profit and spot issues before they grow into crises. Tracking utilisation is one of the most reliable ways to keep an engineering firm both healthy and profitable.
Poor utilisation is one of those quiet profit killers. You do not notice it straight away, but over time it can drain margins faster than any single bad project. For instance, take a 20-engineer firm working at 55% billable utilisation. Compared with a healthier rate of 70%, that is hundreds of hours each month that are not being billed to clients. Those are hours you are paying for, but that they bring nothing back in.
It is not just about lost revenue in the present. Underutilisation means you are carrying costs without the corresponding income, which chips away at your ability to invest in better tools, hire when needed or even keep salaries competitive.
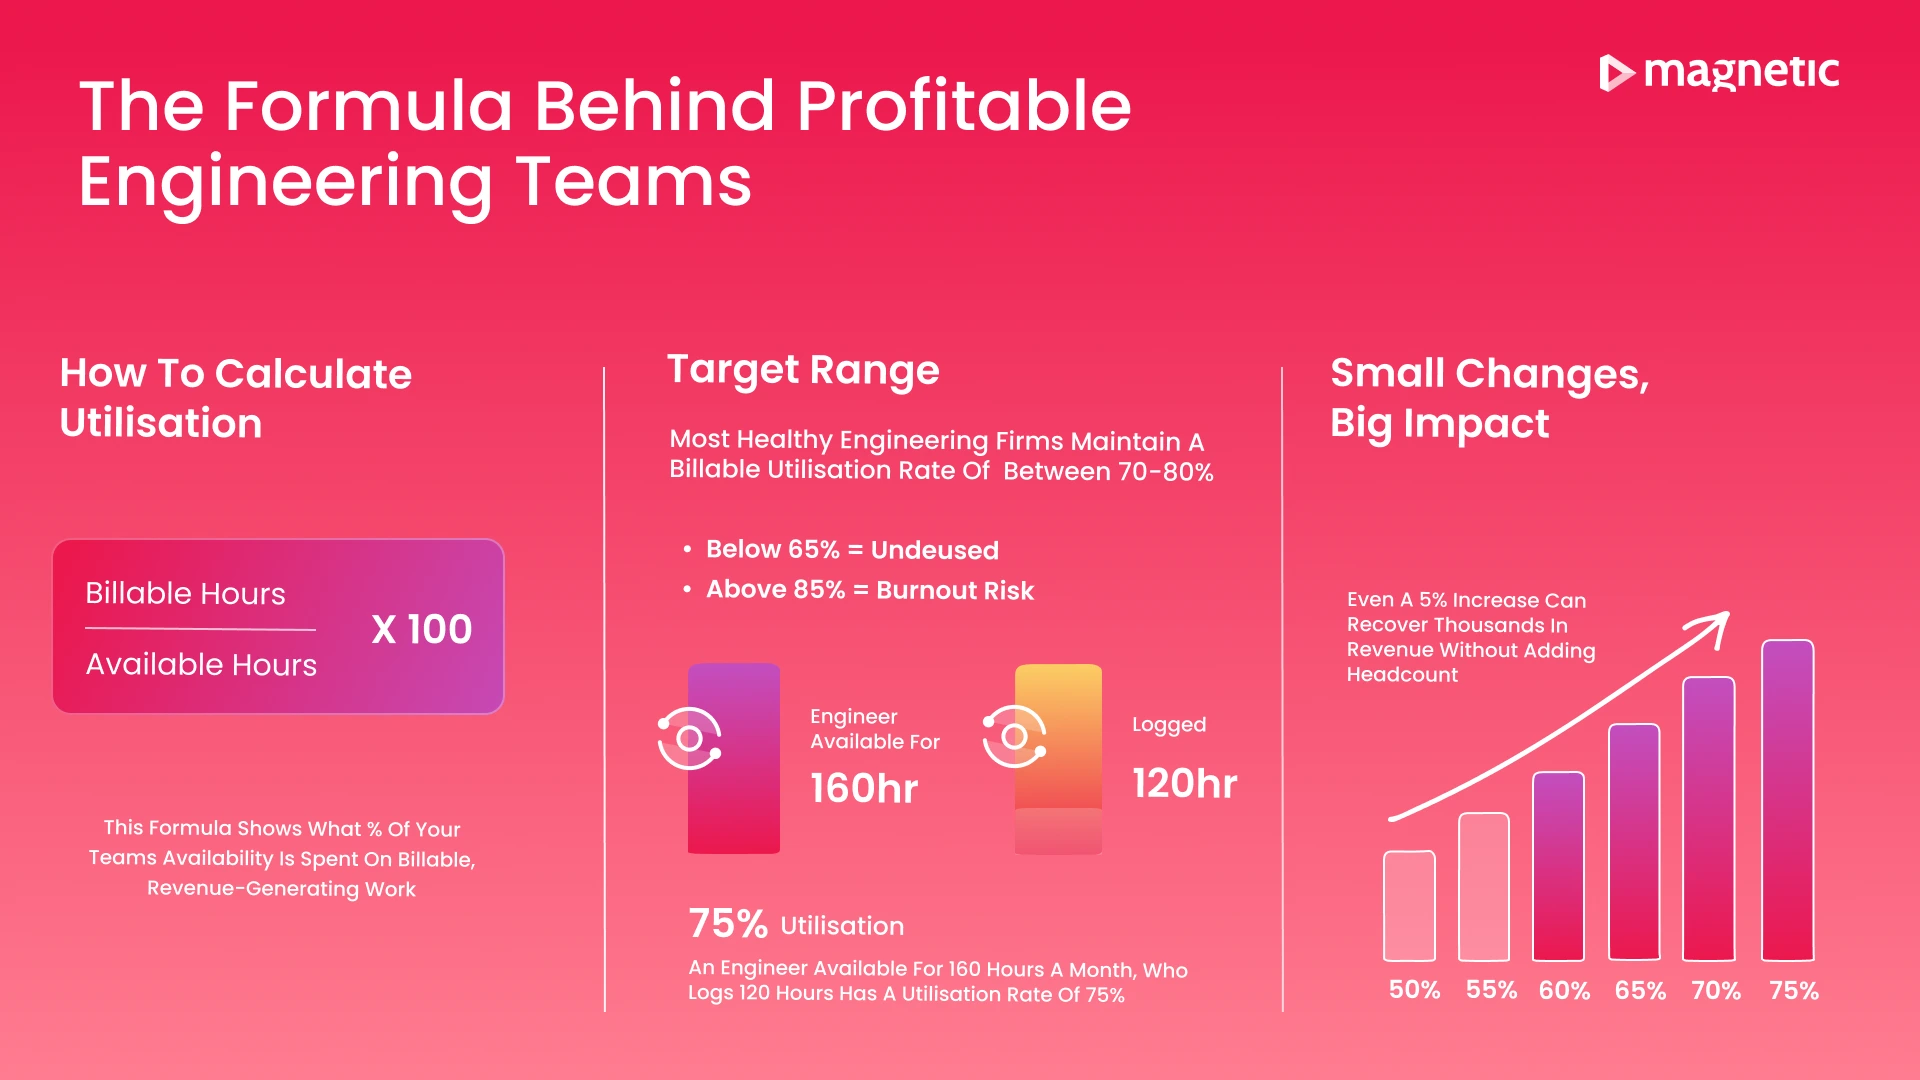
Let’s put that into harsh perspective: Even a 5% shortfall is like losing an engineer’s salary every single month.
*Based on 20 engineers, 160 available hours per month each.
Small shifts in utilisation have a huge impact on the bottom line. The only way to close that gap is to measure it accurately and act on the insight quickly.
If you want to stop guessing and start making decisions based on facts, you need to know your resource utilisation rate.
The calculation itself is simple:
This gives you the percentage of an engineer’s available time that is spent on work you can invoice for. Here is how to work it out step-by-step.
Start with the total working hours in a given period. For example, a full-time engineer might be available for 160 hours in a month (based on 40 hours a week over four weeks). Subtract planned leave or public/bank holidays to keep the number realistic.
Billable hours are those you can invoice to a client. Non-billable time includes internal projects, training, admin or business development. You need accurate time tracking to separate the two.
For an individual: divide their billable hours by their available hours, then multiply by 100. Do the same for each engineer, then average them for a team or roll it up across the firm.
Let’s say you have one engineer available for 160 hours in a month. They log 120 billable hours and 40 non-billable hours.
At firm level, imagine 20 engineers each with 160 available hours in a month:
This means that across the firm, three-quarters of the available time is generating revenue. The other quarter is not (which might be fine, or might be a problem, depending on your targets).
By calculating this regularly, you can see trends before they turn into trouble. That could be spotting an underused engineer, recognising when the team is overloaded, or deciding whether a new hire is genuinely needed.
Once you know how to calculate utilisation, the next question is obvious: what should you be aiming for?
For most engineering firms, a healthy billable utilisation rate sits between 70% and 80%. This leaves enough room for essential non-billable activities like training, internal projects, admin, and business development, while still keeping the bulk of your team’s time focused on revenue-generating work.
Aiming for 100% might sound appealing, but in practice it is both unrealistic and unhealthy. No engineer can be billable every single hour without sacrificing quality, creativity, or their own wellbeing. A relentless workload leads to burnout, mistakes, and staff turnover, all of which cost more in the long run than a few unbilled hours.
Targets should also be set with the realities of different roles in mind. Senior engineers may have slightly lower billable targets because they spend more time on project oversight, mentoring, or technical strategy. Project managers often log far fewer billable hours because their focus is on coordination and client communication rather than direct delivery.
Your targets should also reflect the health of your project pipeline:
In short, the right utilisation target is the one that balances productivity, quality, and sustainability. And it will shift as your workload and business priorities change.
Knowing your utilisation rate is only useful if you act on it. The right data turns guesswork into confident decision making.
One of the biggest benefits is clarity around hiring. If your numbers show a sustained increase in billable hours close to or above your target, you can hire proactively before the team reaches breaking point. On the other hand, if utilisation is dropping, it may be better to hold off on recruitment and focus on winning more work first.
Utilisation data also helps you adjust workloads before they become a problem. If one team is overloaded while another has spare capacity, you can redistribute tasks to prevent burnout and keep delivery on track. This kind of balancing act is much harder without a clear, up to date picture of who is working on what.
It also plays a role in prioritising projects. High value work should take precedence over low margin or speculative projects when resources are tight. With accurate utilisation tracking, you can make those calls based on real capacity rather than assumptions.
The most effective firms take this a step further with predictive utilisation planning. By combining current utilisation data with your project pipeline, you can forecast how busy your team will be in the weeks or months ahead. That gives you time to plan hiring, shift resources, or line up additional work before any shortfall or overload becomes a reality.
Once you know why utilisation matters and how to calculate it, the real challenge is keeping that data accurate and current. This is where Magnetic’s real-time dashboards come in.
These dashboards give you a clear view of utilisation across individuals, teams and the entire firm. The system automatically pulls data from your projects and billing records, so you are not wasting time on manual calculations or trying to reconcile different spreadsheets. Every figure is based on live information, which means you can trust the numbers in front of you.
With this level of visibility, you can move from reacting to problems to preventing over-allocation or underutilisation before they damage your margins. Identify workload imbalances early, and make staffing and project decisions based on facts rather than assumptions.
Because utilisation data is linked directly to your project pipeline and financials, you can see how current workloads connect to revenue targets. If a high value project is about to kick off, you can reassign resources in advance. If your team’s billable hours are trending down, you can line up new work or adjust timelines before the slowdown hits your margins.
Firms using Magnetic often recover lost capacity without adding headcount. It is about having the right information at the right time, and knowing exactly where to act.
Resource utilisation is one of the clearest levers for improving profitability in an engineering firm. When it is tracked properly, it gives you the insight to balance workloads, protect margins and keep delivery standards high.
Relying on spreadsheets or manual updates creates a lag that leaves you reacting to problems instead of preventing them. By the time you spot an issue, the lost revenue or overworked team members may already have taken their toll.
With Magnetic, utilisation data is live and accurate. You can see billable versus non-billable time across individuals, teams and the entire firm as it happens. That makes it far easier to make the right calls on hiring, project priorities and resource allocation.
If you want to see exactly how this works in practice, book a demo and explore Magnetic’s real-time utilisation dashboards for yourself. A short session could reveal hidden capacity, lost billable hours and opportunities to protect your margins without increasing headcount.
Most engineering firms aim for a billable utilisation rate between 70% and 80%. This allows for essential non-billable work like training, internal projects and admin while keeping enough time focused on revenue-generating work.
.svg)
The most effective firms track utilisation continuously using real-time software. At a minimum, you should review it weekly to spot issues before they impact delivery or revenue. Monthly reviews can work, but they are more reactive and risk missing early warning signs.
Yes. When you know exactly where time is going, you can recover lost billable hours, balance workloads and focus on higher value projects. Even small improvements in utilisation can add thousands in extra revenue each month.
Magnetic pulls data from your projects and billing records automatically. It calculates utilisation for individuals, teams and the entire firm without the need for manual spreadsheets. You can see live figures and use them to make staffing, pricing and scheduling decisions on the spot.
Predictive utilisation planning uses current utilisation data and your project pipeline to forecast future workloads. This allows you to plan recruitment, shift resources or line up new projects before over-allocation or underutilisation become costly problems.
At least quarterly, but ideally whenever your project pipeline or team structure changes. Utilisation targets aren’t static; they should evolve with workload, seasonality, and staffing levels. Reviewing them regularly keeps goals realistic and prevents over- or under-capacity from becoming a problem.

Magnetic is an all-in-one workflow management platform designed and built for professional services firms.