📊 Free agency tool - no sign-up

Is your agency actually profitable?

Invoices go out. The work gets done. But once you add up the hours, salaries and third-party costs, the real number is often smaller than you think.

Profitability Calculator

Enter your project details to model your margins

RoleRate ($/hr)HoursCost

Your Report

Hit calculate to see results

Gross Margin
Calculate to reveal your report
Fill in your project details on the left, then hit Calculate
Cost Breakdown
Total Billing
Cost of Hours
Purchases
Performance
Gross Margin
Margin %
Utilization
Effective Rate
Estimates based on industry averages. For real-time tracking, use Magnetic.

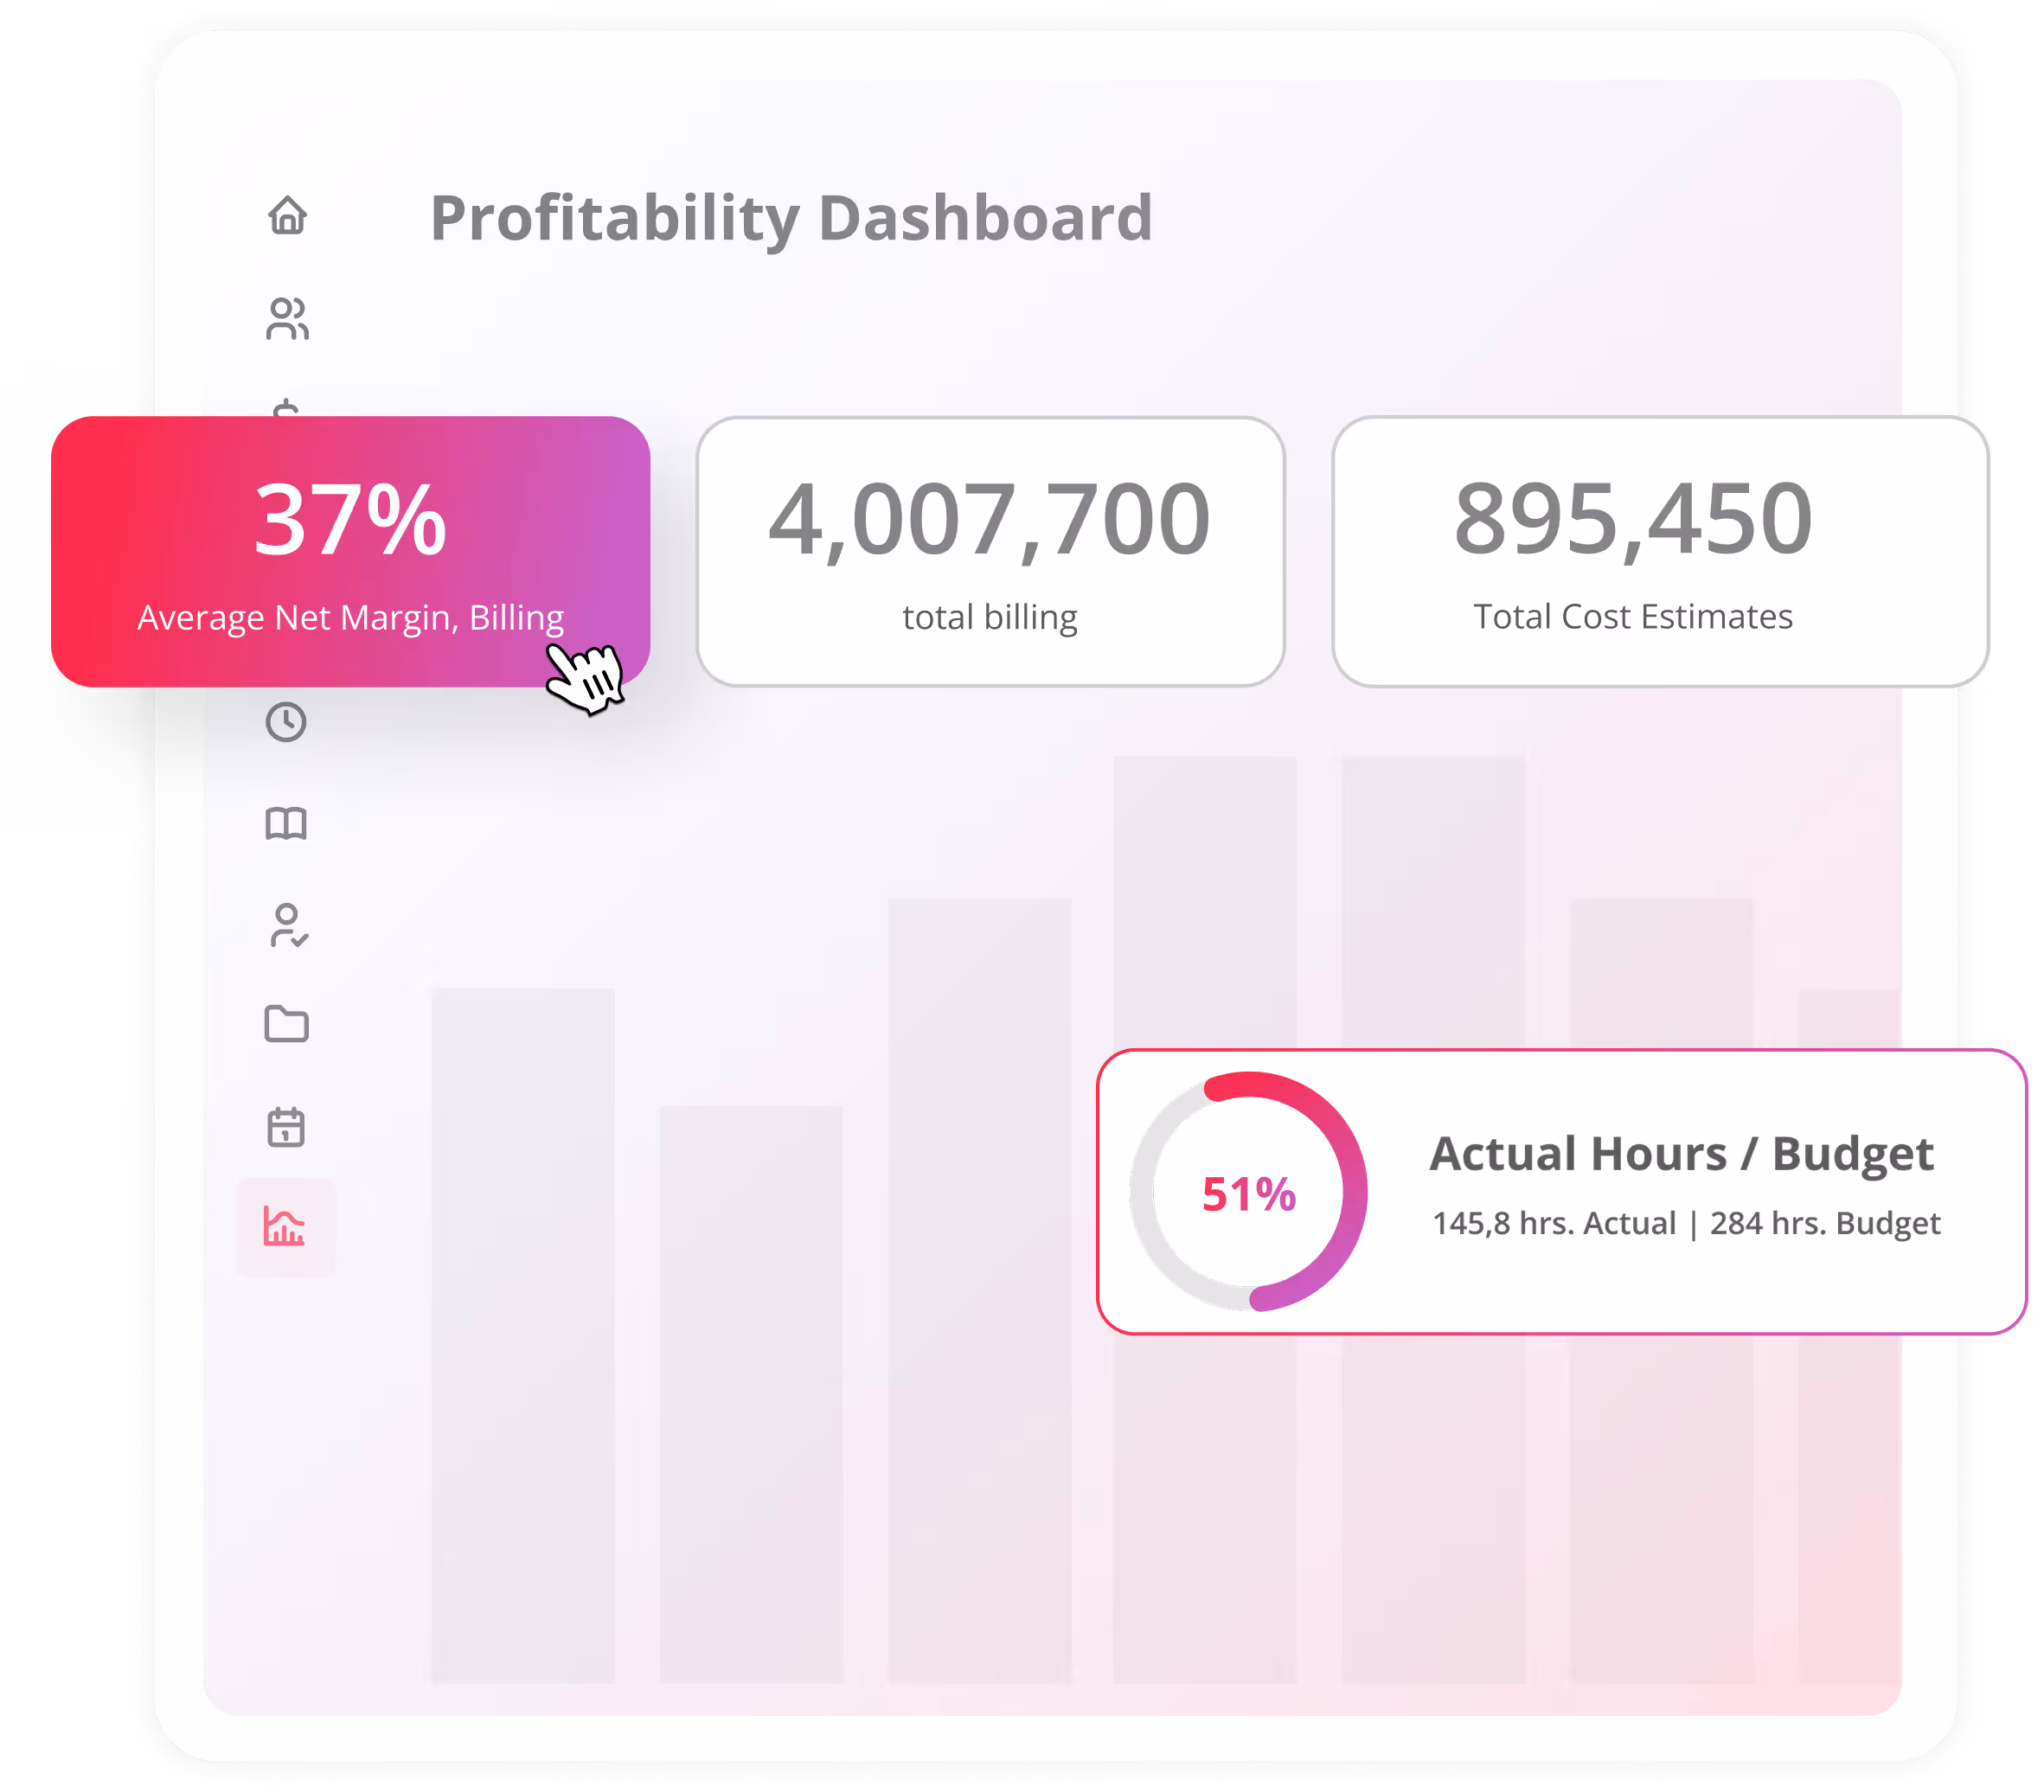
This is a snapshot. Your real margins change everyday.

Right now, you're looking at a static calculation. In practice, your margins shift as hours get logged, scope screeps and costs come in.

Magnetic tracks project profitability automatically - across every client and every team member. You see your margins in real time, instead of finding out you over-seviced a client three months later.

How to use it

Four Steps. Two Minutes

1
Pick your industry

Select from the dropdown -pre-set to agency, works for any services business

2
Enter your billing

Project billing and third-party costs - freelancers, software and media spend.

3
Add your team

Roles, hourly rates and hours worked. Everyone who touched the project

4
Hit calculate

One tool for your whole company. Free for teams to try.

Profit isn't just "what's left after the invoice"

Over-servicing is invisible until you measure it. This calculator is the first step

what this tells you

The numbers that matter

If you're the person the client calls when something feels off, you need more than a project management tool. Whether you're at a creative agency, a consulting firm or an in-house team, you need a system that connects what was sold to what was scoped, what's been delivered and what is cost. That's Magnetic

See what projects actually earn
Not what you invoiced. Not what you assumed you earned. The real number with all costs factored in.
01
Catch over-servicing early
If your margin is 15%, you're either under-charging over-delivering. Both are fixable once you can see it.
02
Compare clients and projects
Run the numbers for different clients. You'll find one or two eatcing your margins, while others fund the business.
03
Get everyone aligned
When finance, account services and the MD see the same margin figure, you stop arguing and start taking action.
04

Built for people running professional services firms

If any of these sound familiar, this tool was made for you.

Agency founders who suspect some clients are more profitable that others but cant prove it.
Ops and finance leads tired of reconciling spreadsheets to get a margin number
Account directors who want to scope more accurately next time
Anyone who's finished a project and thought "we definately lost money on that one"

Stop Guessing.
Start seeing your margins.

Magnetic replaces the spreadsheets and the disconnected tools. CRM, projects, resources, timesheets, finance, reporting. One system with profitability tracking built in from day one.

Free for 14 days | No credit card required
G2 logoCapterra icon white
4.5 stars on G2 and Capterra
Related resources

Blog and articles

3D illustration of translucent layered charts with a purple pie chart on the front, labeled Profitability against a pink gradient background.
Agency Profitability Playbook: Growing Margins Without Growing Headcount
Three ascending bar charts with upward arrows on top and dotted lines connecting points across the bars against a gradient red and orange background.
How CFOs Can Get Cash Flow Forecasting Right in Small Professional Services Firms
Stylized 3D dashboard interface with line graph and two circular progress charts on a pink-red panel.
Real-Time Profitability Dashboards and the Cost of Flying Blind