
Time is money, sure. But any CFO knows that it’s also margin, forecasting, staffing and sanity.
Two of the most telling metrics in professional services are utilisation and realisation. The problem is, most finance teams track one and overlook the other.
This guide is here to fix that.
We’ll unpack both utilisation rates and realisation rates in plain language, show you the formulas behind them, and explain why they matter more together than they do apart. Whether you’re in charge of spreadsheets or strategy, this is about making your time and billing data actually mean something.
At its core, utilisation rate is just a fancy way of asking: how much of your team’s time actually brings in money? It measures the percentage of available hours spent on billable work, which is a nice way of separating the productive from the busy.
After a dictionary definition?
The percentage of an employee’s available working hours that are spent on billable tasks or client work. It measures how effectively time is being used for revenue-generating activities.
Here’s the maths:
Billable hours ÷ total available hours x 100
So, if a consultant has 200 hours up for grabs in a month and 160 of those go to client work, that’s an 80 percent utilisation rate.
Not bad, right? Sure, unless those hours are under-priced, written off, or belong to someone who’s two coffees away from collapse. High utilisation on its own is a half-truth. It tells you who’s been flat out, not whether the work was worth doing. For that, we need to talk about realisation.
If utilisation shows how busy your team is, realisation shows how much of that busyness turns into actual income. It measures the percentage of billable work that ends up on an invoice — and better yet, gets paid.
Let’s get you that dictionary definition again:
The percentage of recorded billable hours or revenue that are ultimately billed and collected. It reflects pricing integrity, write-offs and how much value the business actually captures from client work.
There are two ways to work it out:
(Billed hours ÷ Billable hours) × 100
Or
(Billed revenue ÷ Billable revenue) × 100
Say a consultant logs 100 billable hours, but only 90 make it onto the invoice. That’s a realisation rate of 90 percent. The missing ten? Lost to discounts, write-downs, scope creep or a client who sweet-talked their way into more work for less money.
This is the metric that tells you whether your pricing is holding up, or whether your business is quietly leaking revenue through the cracks.
It is easy to lump these two together, especially if you are glancing at dashboards without digging too deep. But while utilisation and realisation both deal with time and billing, they measure different parts of the financial journey and they highlight different problems.
Utilisation shows how much of your team’s available time is spent doing billable work. That is your internal productivity story.
Realisation, on the other hand, shows how much of that billed time is actually making it onto an invoice and being collected. That is your revenue capture story.
Think of it this way: one tells you who has been flat out. The other tells you whether all that effort was worth it.
Here is how they compare side by side:
If you are only tracking one of these metrics, you are making decisions with one eye closed. Utilisation on its own can tell you how busy people are, but it cannot tell you if that work is being billed correctly, or even billed at all. Realisation on its own tells you how much billed time gets paid, but without utilisation, you cannot see whether the team could have handled more or if they were already stretched.
In short, one tells you how full the engine is. The other tells you how far the fuel actually gets you.
The smarter move is to look at both together, and more importantly, to look at how they flow into each other.
That is where the utilisation to realisation funnel comes in.
Imagine it like this:
The result?
Your effective revenue yield is just 68 percent.
So for every hour your team is available, only 68 percent is turning into money. Not because people are slacking off, but because time is falling through the cracks – either through over-servicing, undercharging, or work getting written off altogether.
This is where things get interesting for a CFO.
It is not just about working harder or billing faster. It is about understanding where the yield is dropping and why. Are you pushing utilisation at the cost of pricing integrity? Are you discounting work because scoping was off from the start? Are your best people tied up in non-billable work while junior staff overrun their hours?
None of these questions can be answered by looking at one metric alone. But when you start to track utilisation and realisation together (and map how they interact) you begin to see the shape of the business in sharper detail. You can see where time becomes money, and where it does not.
And once you see that, you can do something about it.
Good utilisation means nothing if you’re not billing on time. Unbilled WIP might look like progress on a report, but all it really shows is effort that isn’t turning into earnings. When teams are managed well, you see it in the numbers—work moves, invoices go out, and time actually becomes revenue." - Byron Riddle, CFO, Silversoft
How much of your team’s time actually turns into revenue? Use Magnetic to see where time is being spent, what is being billed, and what you are actually collecting. No spreadsheets. No guesswork. Just clarity.
[BOOK A DEMO]
Getting these metrics wrong is not always about bad data. Often, it is about misreading the story they are trying to tell.
Here are a few traps firms fall into, and what they will cost you.
At first glance, this looks like a win. Your team is flat out, calendars are full, and timesheets are overflowing with billable hours. But if your realisation rate is low, it means that work is not being billed properly, or at all. That could be down to over-servicing, missed scope creep, internal write-offs or projects priced too low from the start.
The danger is that people burn out doing work that barely makes it onto an invoice. And finance is left wondering why revenue is not keeping up with effort.
This one is quieter but just as costly. Your realisation rate looks good and nearly everything billed is being paid. But low utilisation means your team is not spending enough time on billable work in the first place. It could be a sign of poor resourcing, too many internal tasks, or simply not enough work coming in.
You will not feel it immediately. But over time, the business starts to drift. The team is being paid, but not pulled into enough revenue-generating work.
One department counts admin as non-billable, another logs it as billable-but-unbilled. One team includes travel time in utilisation, another drops it completely. Before you know it, the same report looks wildly different depending on who is pulling it.
If you want these metrics to mean something, they need to be measured consistently across the board. That means agreeing on what counts as billable, what counts as available time, and how both are tracked. Otherwise, you are not improving performance, you are just moving numbers around.
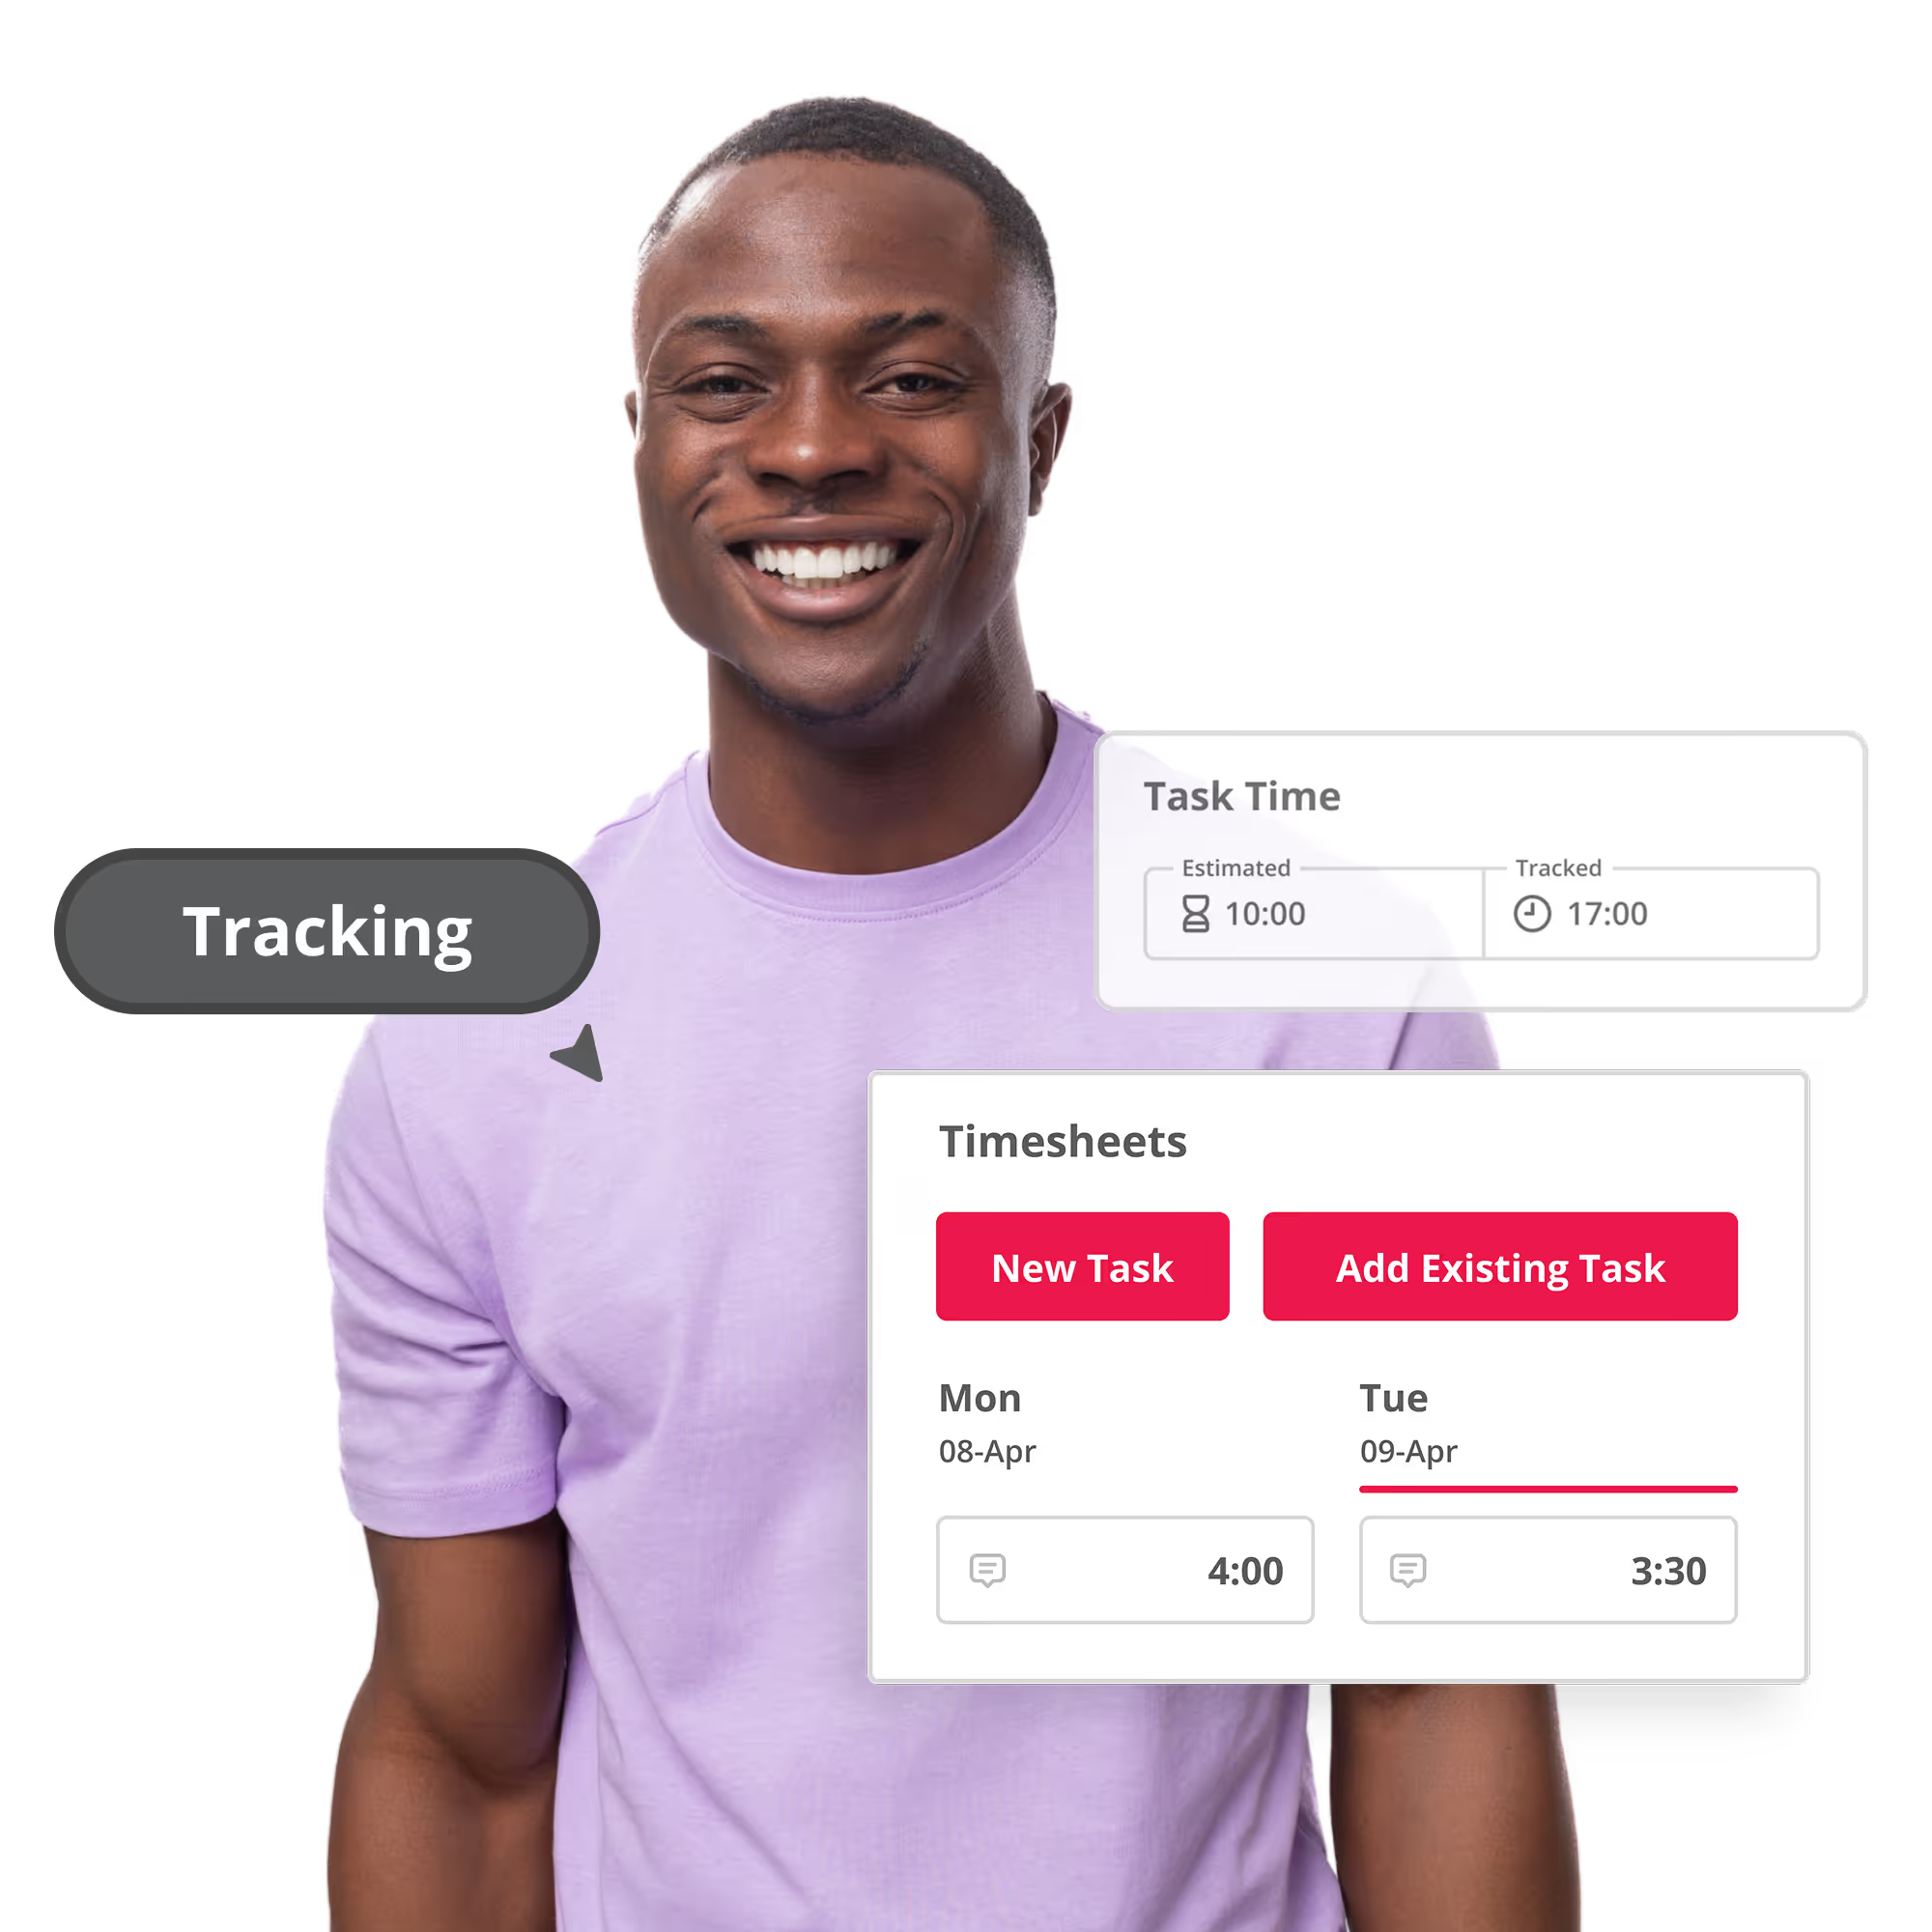
Magnetic puts every time and money signal on a single set of screens, so you can spot trouble before it hits the ledger. Here is what that looks like in practice.
Together, these screens close the loop from capacity to revenue. You see the hours as they are logged, watch them turn into invoices, and track how much cash actually lands. No blind spots, no manual stitching, just one clean line from time to money.
If you only track utilisation, you might think your team is performing. If you only track realisation, you might think your pricing is working. But without both, you are guessing.
The gap between those two numbers is where profit hides, or where it quietly disappears. That gap is also where CFOs can make the biggest difference. Not by wringing more hours out of people, but by seeing the full picture. Who is working, what they are billing, what is actually being collected, and how it all stacks up.
Magnetic gives you that picture in one place. Real-time dashboards. Consistent metrics. Alerts when things slip. And reporting that ties effort to outcome without the need for duct tape and spreadsheets.
In short: Utilisation rate = % of available time spent on billable work. Realisation rate = % of billable time that actually gets invoiced and paid. Why it matters: Utilisation reflects team productivity. Realisation reveals billing effectiveness and revenue capture. You need both to understand how well your firm is converting time into profit.
.svg)
Most firms aim for: 75% to 85% Why: This range supports a healthy mix of billable and non-billable time (like admin, training, internal planning). Above 90% may look efficient but often leads to burnout or declining quality. Below 70% can suggest weak resourcing or insufficient client work.
Two standard methods: (Billed hours ÷ Billable hours) × 100 (Billed revenue ÷ Billable revenue) × 100 Example: If a consultant logs 100 billable hours but only 90 are invoiced, the realisation rate is 90%. Why it’s important: Shows how much effort is lost to discounts, write-offs, or scope creep. Highlights potential operational margin leakage.
Because: Utilisation tells you how busy someone is. Realisation tells you whether that busyness is profitable. Even with high utilisation: Poor billing, underpricing, or write-downs can drag profit down. Realisation is your profit conversion rate - it reflects actual financial performance, not just effort.
All in one place: Time tracking: Logged via Timesheets, tied to projects and clients. Utilisation: Tracked in the Resource Management view. Realisation: Monitored through the Finance Management dashboard. What you get: Side-by-side comparison of both metrics. Real-time alerts when either drops below target. Everything’s in one place, updated in real time, so you’re not chasing spreadsheets or month-end reports.
Common causes: Underpricing or inaccurate project scoping Excessive write-offs or discounts Poor billing follow-through Over-servicing clients without compensation The result: Teams do the work, but revenue slips through the cracks. Most of the time, low realisation comes down to billing gaps, not a lack of effort.

Magnetic is an all-in-one workflow management platform designed and built for professional services firms.