Most professional services firms are losing money. Not because their people aren’t skilled, or their clients aren’t valuable, but because they can’t see what’s actually going on inside their own business.
Across accounting, engineering, architecture and consulting, firms are are haemorrhaging revenue each year due to what we call "visibility gaps" - the blind spots between projects, people and profitability.
These gaps manifest in several ways including un billed hours, unforeseen project delays that damage client trust and top performers burning out under uneven workloads.
The result is disconnect. Leadership see a healthy well-run business, while the day-to-day operations tell a different story. One recent study of consulting firms found that 44% of businesses failed to meet their revenue targets, due to internal blind spots like poor forecasting and misaligned capacity. In fact, 86% of leaders from the study were under the impression that their teams were fully utilised, but one in three admitted that they lacked clear visibility into team utilisation.
In this article, we’ll unpack where these gaps come from, how much they really cost, and how to close them before they start compounding.
A visibility gap is the space between what leaders believe is happening inside the business and what’s actually going on. It's the blind spot created when data lives in silos, updates arrive too late or managers rely on intuition instead of facts.
In professional services firms these gaps creep in quietly and surface in whats that are easy to dismiss - until the consequences are too large to ignore:
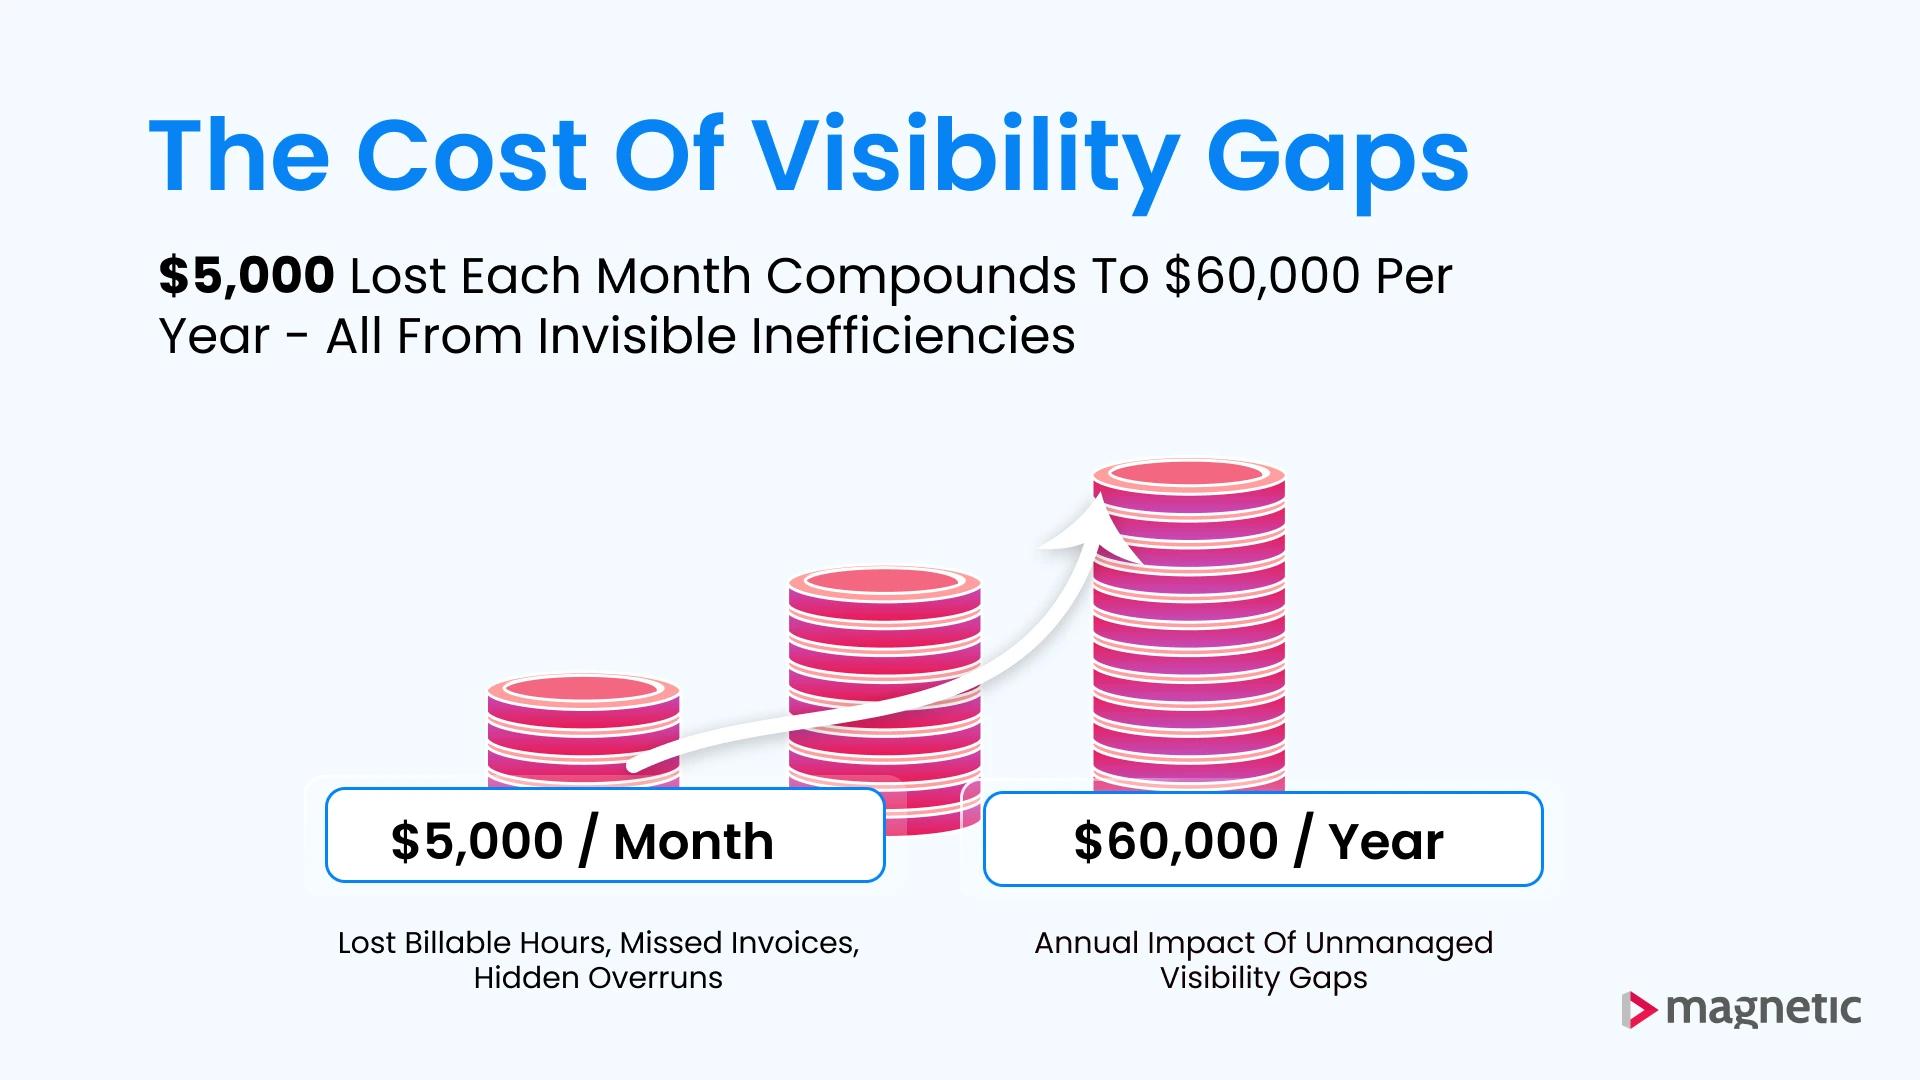
Even small blind spots like these, can add up to major financial loss in the long run
Example:
Imagine a 50-person consulting firm billing R1000,00 per hour. If just 10% of billable time goes untracked or unbilled, that R500,000 lost every month - more than R6 million in a single year.
And that's only the lost billings you can put a number on. The harder-to-measure costs are often worse:
When visibility is missing, the firm may look busy on the surface, but it is rarely building sustainable profitability underneath.
Most visibility issues are rarely caused by a lack of effort from your team. They are directly linked to a fragmented system of tools that were not designed to work together.
The most common culprits in creating these silos include:
When these tools don't communicate, there is no single source of truth and this fragmentation naturally drives leaders to make decisions on gut feel and outdate reports, trapping them in a reactive cycle where they spend more time looking backward at what went wrong, rather than planning for what lies ahead.
The solution is not more tools, but a single integrated operating platform that connects the dots across the entire business. An effective system brings three key component together to create clarity across your business.
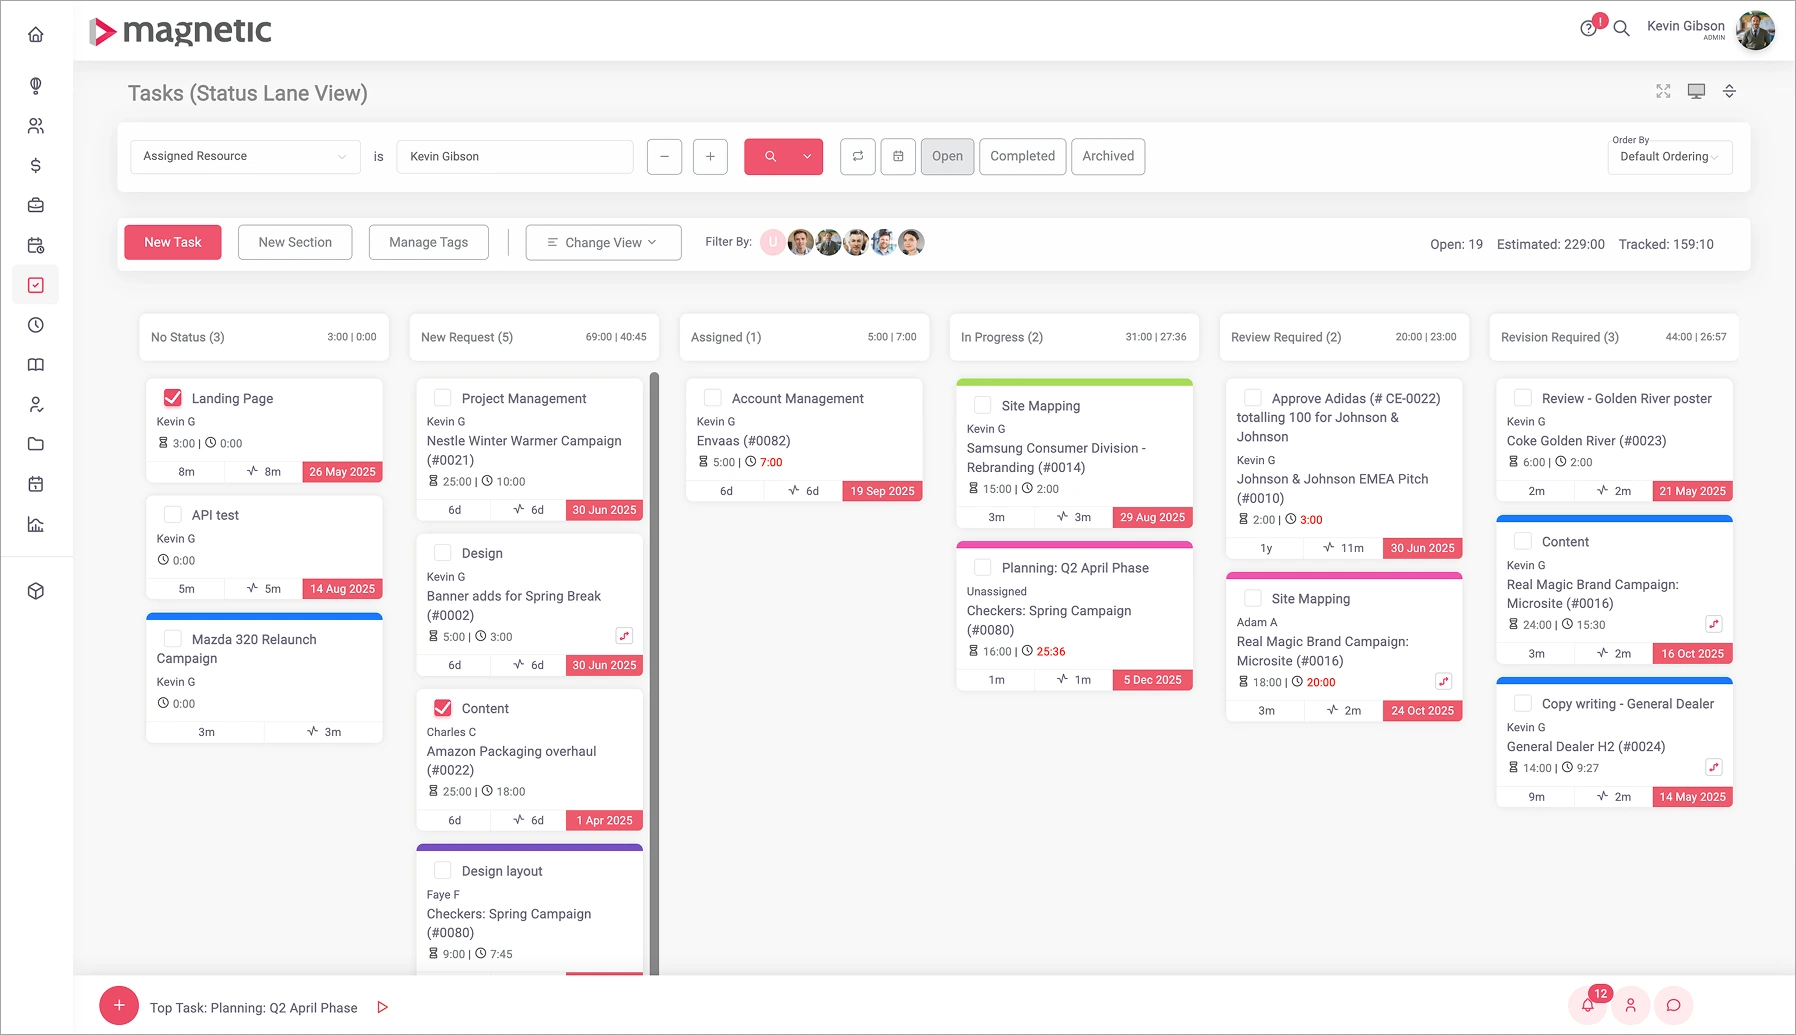
1. Centralised project and resource management
You shouldn’t have to switch between multiple tools just to see how project and resource data connect. Bringing everything together into one platform makes it easier to track progress, balance workloads across your team and spot risks early in the project lifecycle.
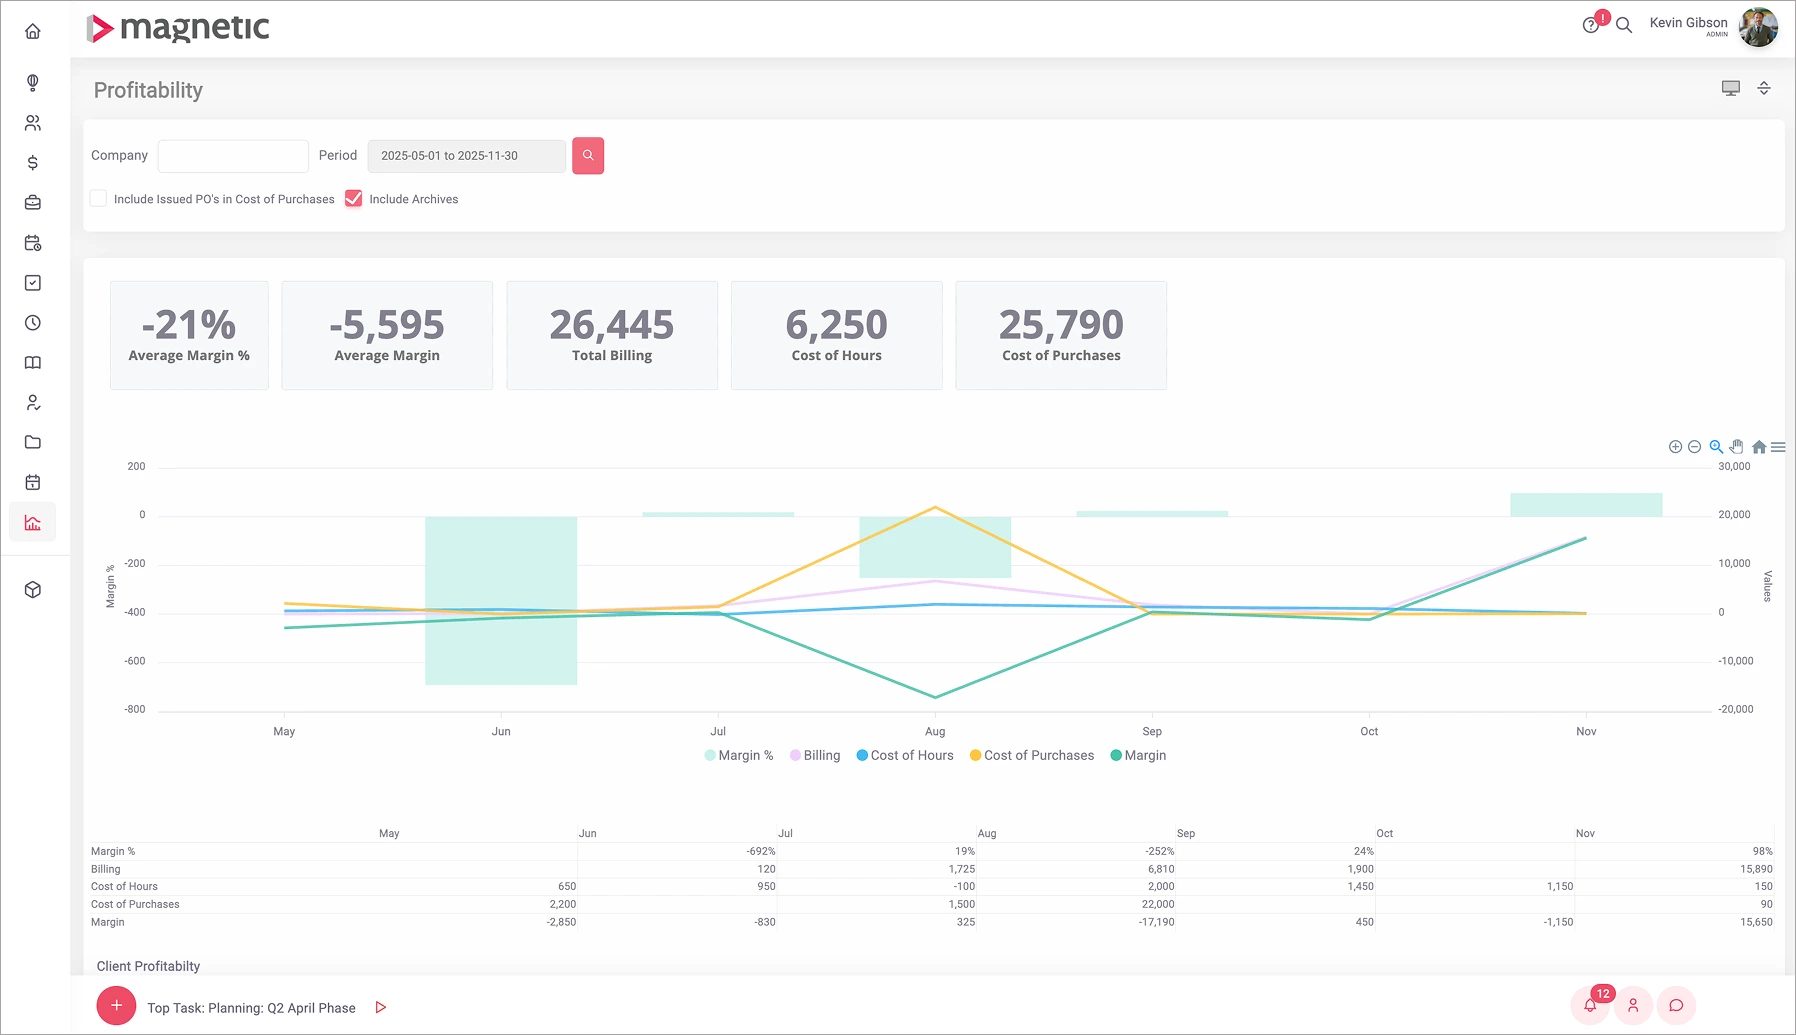
2. Real-time dashboards - Financial and operational data should never be something you have to “go and find”. Financial and operational data should be visible in real time, so you can see where you stand on revenue, billable hours and project progress in one glance.
3. Integrated reporting that actually helps you decide
Data isn’t useful if it sits in a silo. You need reporting that connects the dots between your projects, your people, and your profits in a way that helps you make smart decisions without pulling in a consultant.
Magnetic is an all-in-one professional service (PSA) platform built for firms that need a clear view of profitability and visibility into how different parts of the business fit together, without relying on multiple tools. Instead of running projects in one place, timesheets in another and project financials elsewhere, Magnetic brings everything into one connected system.
Here's how it closes the visibility gaps that cost firms millions
With everything in one place, firms stop losing money in the gaps between systems. Leaders move from chasing down information to making proactive decisions informed by live, accurate data. Teams spend less time on admin and more on client work. And clients benefit from smoother delivery and projects that meet deadlines.
When you can see the whole picture you protect profitability and create room for growth.
The benefits of an integrated platform sound compelling, but what do they look like in practice? When a firm achieves full visibility, it changes how the business operates and how decisions are made - in measurable ways. Forecasts stop being optimistic guesses, and become data-backed predictions. Surprise project overruns turn into rare exceptions rather than the norm. Team capacity is managed with far greater precision, ensuring talent is used optimally and not over extended. The end result is a business that runs with more predictability, stronger margins and a bottom line that's protected rather than constantly under pressure.
Here’s what that looks like in practice:
Take Exonic Solutions ,a Johannesburg‑based consultancy, for example. After replacing multiple siloed tools with Magnetic and saw clear operational improvements:
“We’ve seen the value firsthand. Magnetic has helped us replace the noise of multiple tools with a single, reliable system that actually supports how we work.”
– Billy Einkamerer, Managing Director, Exonic Solutions
/
Visibility gaps are not minor operational hurdles, they are an ongoing drain on profit, team morale and long-term business growth potential. They hide in un-billed hours, project overruns, and missed opportunities that silently chip away at the foundation of the business - until thedamage is too significant to ignore.
The firms that grow are the ones who see what’s happening in real time and act on it. They know which projects are on track, which teams are over capacity, and where revenue is being won or lost.
Magnetic gives you a single integrated view of your people, projects and profits - so you can make decisions that grow the business instead of patching leaks.
Schedule a demo and see how Magnetic helps firms like yours close visibility gaps and recover lost revenue.
A visibility gap is the blind spot between what leaders think is happening in the business and what’s actually going on. It usually shows up when data is scattered across spreadsheets and systems that don’t connect, leading to missed hours, uneven workloads, and inaccurate forecasts.
.svg)
Even small gaps can compound quickly. Missed billable hours, delayed invoices, and uneven resourcing eat into margins every month. Over time, these hidden losses can add up to millions in revenue leakage.
Full visibility means you can see projects, people, and profits in one place. Leaders know which projects are on track, which teams have capacity, and what the financial impact will be—all in real time.
Spreadsheets and disconnected tools only give part of the picture. By the time data is pulled together, it’s often out of date. Leaders end up relying on gut feel instead of facts, which makes decision-making reactive rather than proactive.
Magnetic brings projects, timesheets, forecasting, finance, and reporting into one connected platform. That means no more sourcing updates across multiple systems - everything you need to run a profitable firm is in one view.
Magnetic is built for professional services firms - consulting, engineering, architecture, accounting, and agencies - where profitability depends on balancing projects, people, and billable time. Any firm that needs to track utilisation, delivery, and financials in real time will see value.

Magnetic is an all-in-one workflow management platform designed and built for professional services firms.